Calculation of frequencies, strength, and runtime for analyzers
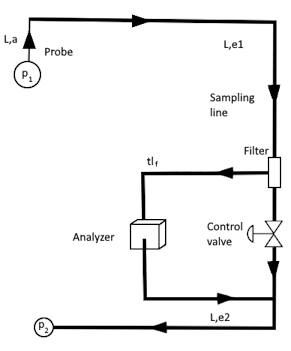
The lag time of the medium from the sample point to the analyzer can be calculated. The pressures at the sampling point and at the return, the probe line (inner diameter, pipe roughness, resistances and length), the sampling line (inner diameter, pipe roughness, resistances and lengths before and after the analyzer) and the lag time from the filter to the analyzer can be taken into account. The lag time can be calculated as a function of the desired flow rate or as a function of the control valve parameters (Cv value or pressure difference).
Alternatively, the flow rate and parameters of the control valve can be calculated by specifying the lag time.
CONVAL® calculates critical values for stress and frequency of thermowells in pipelines and compares these values to the allowed limiting values. Temperature dependent values for the maximum allowable working stress, the elasticity modulus and the density are available for many materials.
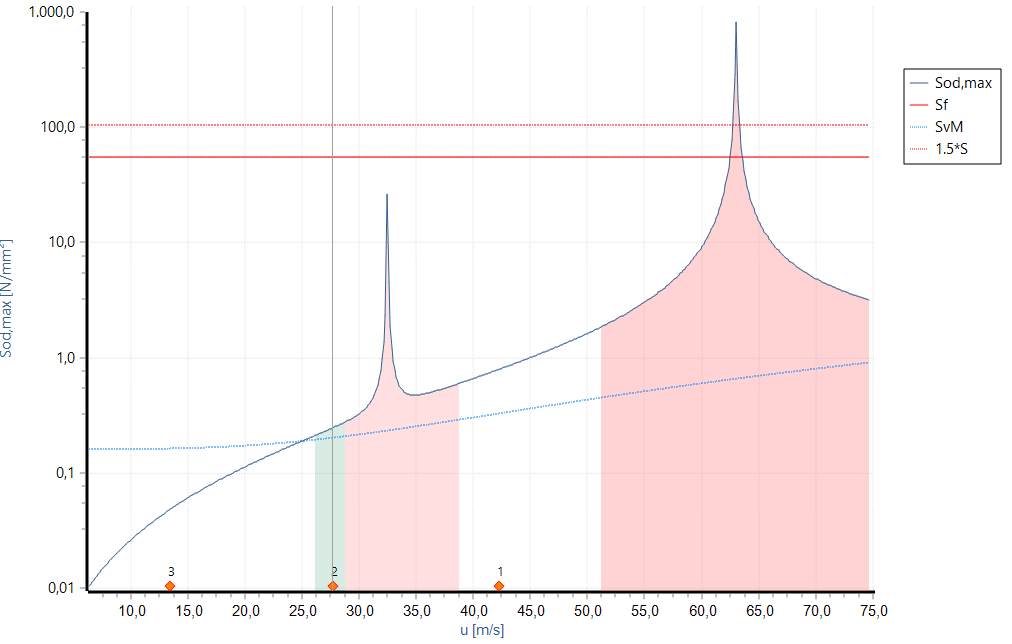
Graphical stress analysis: Stress analysys of a thermowell calculation. The actual frequency ratio of the 2nd operating point is between 40 and 60%.Therefore, the device is not conforming to the standard
The CONVAL® stress pass/fail analysis provides a quick overview of whether the calculation complies with the standard. A color-coded traffic light system immediately points out problem areas.

Pass/Fail view of a thermowell calculation. The conditions for the steady-state stresses, the dynamic stresses, and the hydrostatic pressure are fulfilled (green light). The conditions for the dimensions and the frequencies of the 1st and 3rd operating point are not fulfilled (red light).